
Download this report as a PDF:

Foreword: Paying the Cost of Admission
By Morgan Housel
The stock market is the greatest wealth-generating machine history has ever known. Every dollar invested in the S&P 500 at the start of 1925 is today worth $1,285 — and that’s adjusted for inflation.
The fact that this money machine is available to ordinary people would have seemed preposterous to someone even two generations ago. In 1929, 5% of Americans owned stocks. Today, more than 60% do. Many of them will get rich by owning a slice of U.S. businesses.
If the story ended there, this would sound like a fairytale.
But let me introduce you to the first law of economics: Everything worthwhile has a price. And now, the first law of personal finance: Find the price, and be willing to pay it.
Successful investing demands a price. But its currency is not dollars and cents. It’s volatility, fear, doubt, uncertainty, and regret — all of which are easy to overlook until you’re dealing with them in real time.
Say you want to earn an 11% annual return over the next 30 years so you can retire in peace. Does this reward come free? Of course not. The world is never that nice. There’s a price tag — a bill that must be paid.
Remember that period I told you about when the stock market increased 1,200-fold? Here’s what happened during those beautiful years:
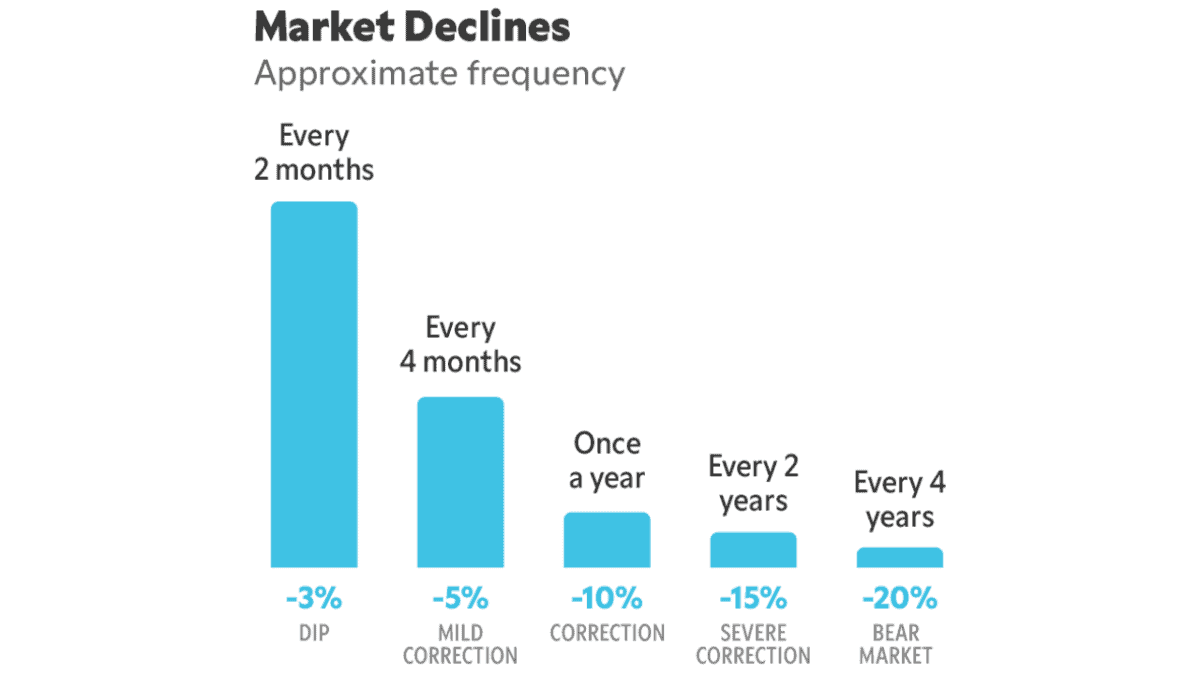
- Stocks fell at least 10% more than 100 times. That’s an average of once every 11 months.
- It fell 15% more than 40 times. Or about once every two years.
- It fell more than 20% at least 23 times. Call it once every four years.
- On 10 separate occasions, it fell more than 30%.
- Three times, it has lost more than half its value.
During a sensational period of wealth creation, the market served up a constant parade of volatility, fear, doubt, and confusion.
Here’s the kicker: Not only is stock market volatility normal, but it is also the cost of admission.
The entire reason the stock market can produce great long-term returns is that its short-term returns are volatile and unpredictable. If you want tranquility, cash and bonds can provide it — for a far lower return.
The cause of most investing problems — most, that is not an exaggeration — is viewing market volatility not as the cost of admission, but as an indication of error.
An analogy might help.
If I get pulled over for speeding and am issued a US$100 ticket, that is a fine. I did something wrong. I am in trouble. I should not do it again.
If I take my kids out to dinner and the bill is US$100, that is a fee. It’s the cost of receiving something in return. No one did anything wrong. I will gladly pay it again.
In the vast majority of cases, market volatility is a fee, not a fine.
Volatility is rarely a sign that you screwed up. Dealing with it is the cost of admission that the market makes you pay to receive excellent long-term returns.
And if you want to sum up the skill of the best investors of all time, it’s this: They identified the cost of admission, and they became willing to pay it.

Introduction
The Nasdaq has tumbled more than 10% from its December high, officially entering a correction, while the S&P 500 isn’t far behind, down over 9%. But this isn’t just a tech-driven sell-off — pressure is mounting across the entire U.S. market.
And the fear is only growing. Investment bank Citi (NYSE: C) recently downgraded U.S. stocks to neutral, warning that “U.S. exceptionalism is at least pausing.” Adding to the uncertainty, U.S. Federal Reserve Chair Jerome Powell signaled that interest rate cuts the market had been counting on may not be coming anytime soon.
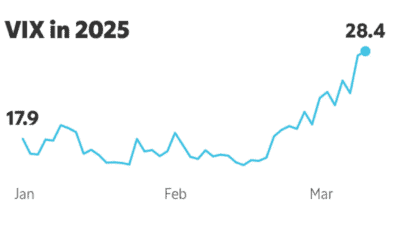
With policy uncertainty rising and economic optimism fading, volatility is surging. The VIX, Wall Street’s so-called “fear gauge,” has spiked 60% this year — a clear signal that investors are growing uneasy as the safety net of government support looks increasingly out of reach.
It’s with this backdrop that we’re bringing investors worldwide a comprehensive toolkit about the current environment. Let’s dig in.
Inside this report:
Economic Shifts, Tariffs Breed Uncertainty
A major driver of the market’s recent downturn is mounting concern about the impact of the Trump administration’s economic policies, from its trade stance and shifting tariffs to widespread job losses and public comments acknowledging turmoil could be ahead. Investors and businesses alike are weighing the fallout — evidenced by the fact that 383 S&P 500 companies referenced tariffs in their latest earnings calls.
Tariffs function as an import tax, raising costs for companies that rely on foreign goods. This leaves businesses with two options: absorb the added expense or pass it on to consumers.
The pressure is already showing. Retailers Best Buy (NYSE: BBY) and Target (NYSE: TGT) have cut sales forecasts, warning that price hikes on essentials like groceries and electronics are inevitable. Delta (NYSE: DAL) and American Airlines (NASDAQ: AAL) have also slashed their profit outlooks, citing concerns that economic uncertainty will weaken travel demand.
Critics argue that escalating tariffs are inherently inflationary. Warren Buffett recently likened them to “an act of war, to some degree,” while Carlyle CEO Harvey Schwartz warned that trade wars have “sustainably inflationary” effects.
The concerns are reflected in economic data:
- U.S. consumer prices rose 2.8% on an annual basis in February, remaining well above the Federal Reserve’s 2% target.
- Economists estimate the Trump administration’s trade policies amount to a $130 billion annual tax increase on Americans, roughly US$1,000 in extra costs per household.
The pessimism isn’t isolated to boardrooms and trading floors — it’s reaching everyday Americans, too.
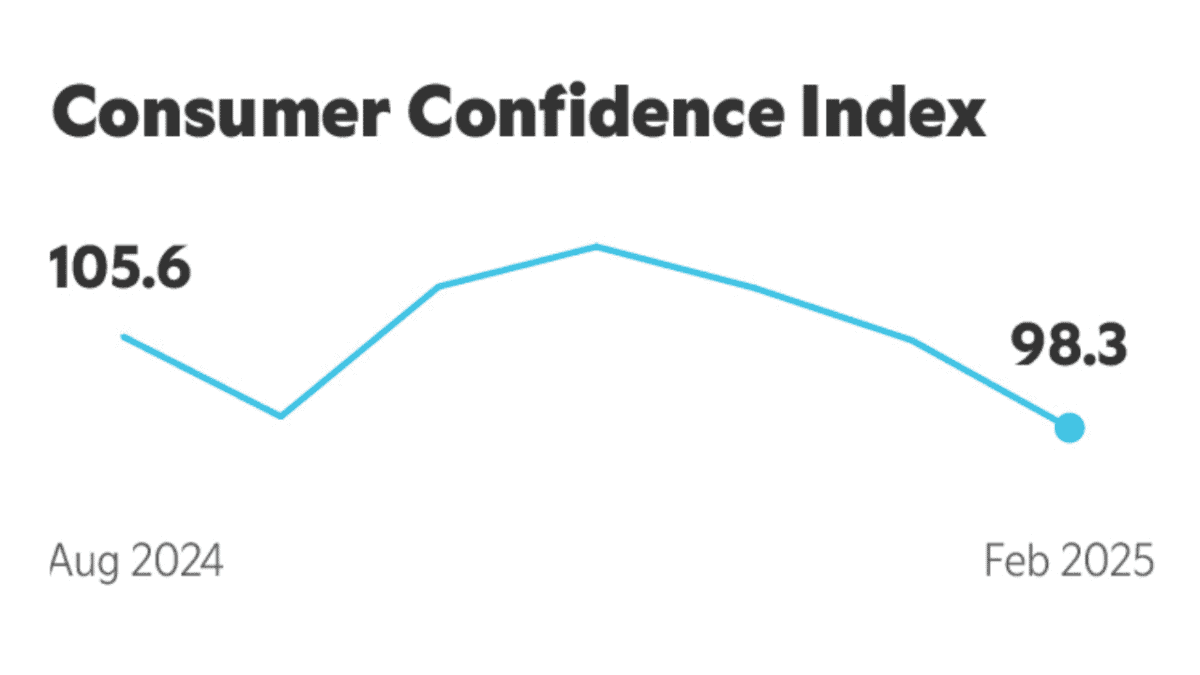
U.S. consumer confidence in February posted its sharpest monthly drop since August 2021, and a survey showed Americans expect inflation to rise by 6% over the next year. That’s a troubling signal in an economy where nearly 70% of gross domestic product (GDP) comes from consumer spending. If households start pulling back, growth could stall, increasing the risk of stagflation — slowing economic activity paired with persistent inflation.
With markets slipping and pessimism rising, it might seem like the worst has passed. But before reaching that conclusion, it’s worth considering just how stretched valuations were at the start of 2025.
Investors Used to Feel Differently
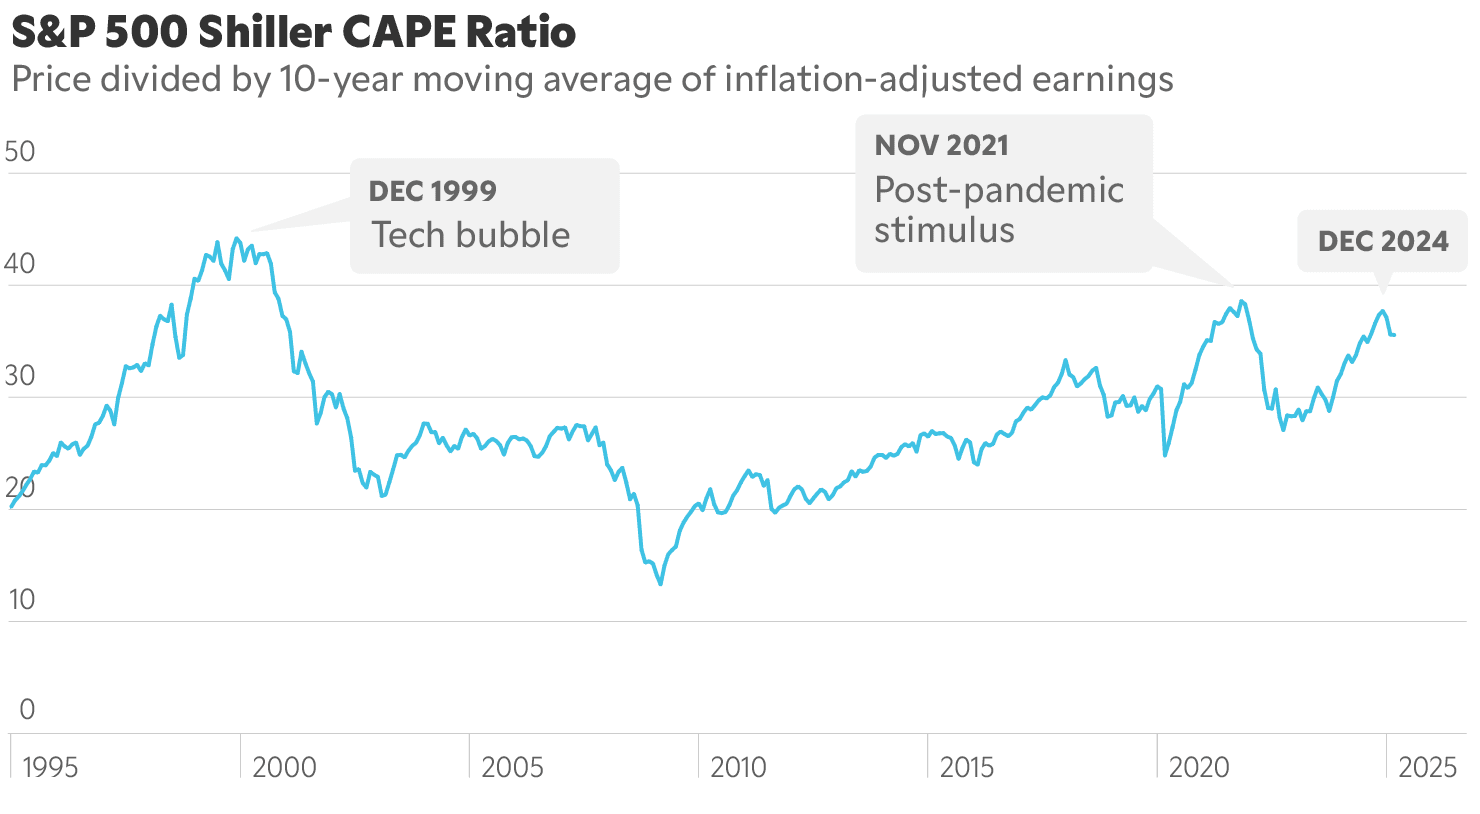
Investor sentiment was near euphoric at the end of last year. The S&P 500 Shiller CAPE Ratio, a cyclically adjusted price-to-earnings (P/E) metric, stood at 37.1 in December 2024 — its third-highest level ever, trailing only the dot-com bubble (44.2) and the post-pandemic stimulus surge (38.6).
The enthusiasm spilled into 2025. The “Buffett Indicator,” which compares total U.S. stock market capitalization to GDP, hit a record 207% in February, surpassing the 195.6% peak from November 2021. Historically, when this ratio exceeds 150%, future stock market returns weaken. Buffett took note — Berkshire Hathaway (NYSE: BRK.B) stockpiled over $330 billion in cash and Treasuries rather than buying more equities.
Traditional valuation metrics also flashed warning signs. At its peak in February, the S&P 500 traded at 25 to 26 trailing operating earnings, while its GAAP price-to-earnings ratio topped 29 — eerily similar to levels seen before the dot-com crash.
History doesn’t repeat, but it often rhymes. Extended bull markets with soaring valuations frequently set the stage for turbulence.
Things Could Get Worse
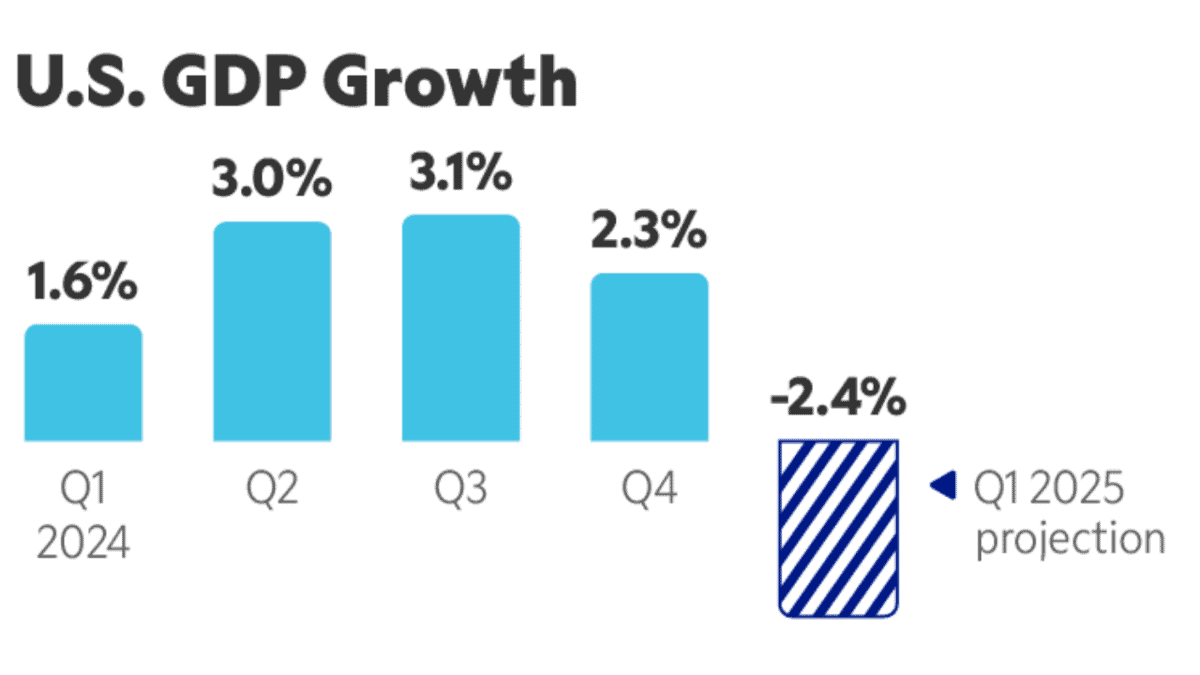 The Atlanta Federal Reserve’s GDPNow prediction tool projects a contraction by about 2% in the first quarter of 2025, a sharp reversal from 2.3% growth in the fourth quarter of 2024. Meanwhile, JPMorgan Chase (NYSE: JPM) economists recently bumped up the risk of a U.S. recession in 2025 to 40%. If a slowdown materializes, recession odds rise, and further stock market declines could follow.
The economy and stock market don’t always move in lockstep, but history suggests that when growth slows, stocks struggle — especially when optimism has already been baked into valuations.
Over the last three recessions, the S&P 500 dropped an average of 38.7%. A similar decline remains a real possibility if economic conditions deteriorate.
Returns as of March 11, 2025
Risks in a Top-Heavy Market
Market downturns don’t impact all stocks equally. The 2022 pullback saw the S&P 500 Growth Index fall 30.1%, while the Value Index dropped just 7.4%. If history repeats, high-growth names could face steeper losses.
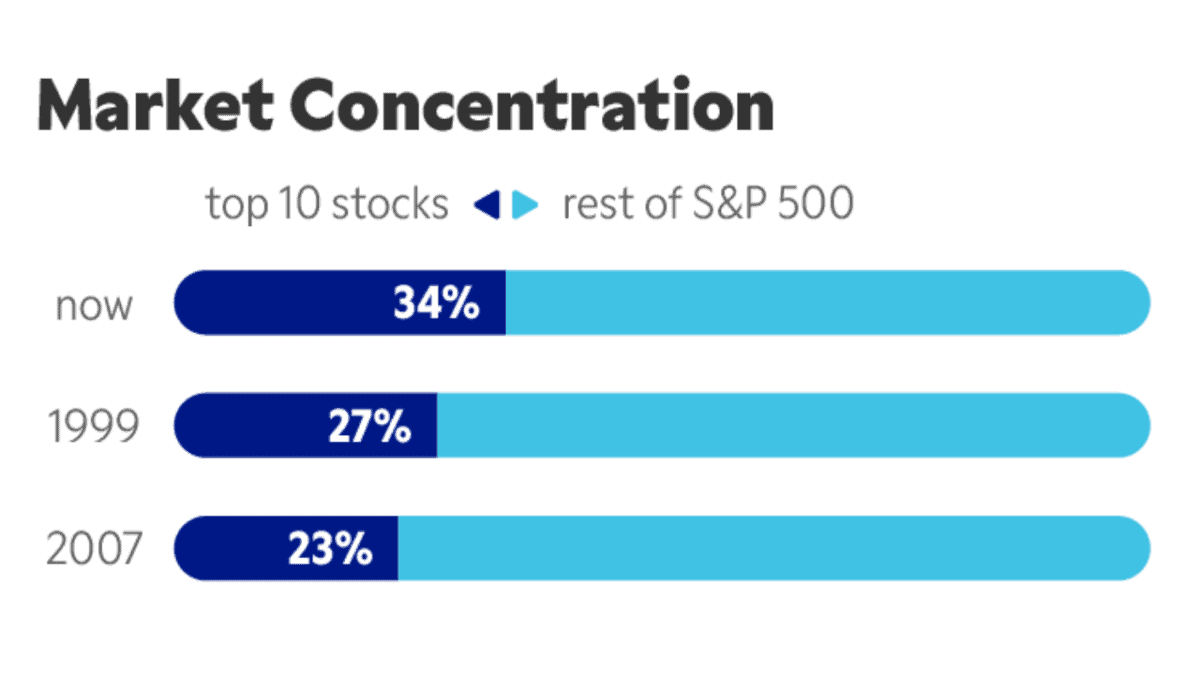
Today’s market is more concentrated than ever. The top 10 stocks now make up nearly 40% of the S&P 500’s total value — far exceeding the 27% concentration seen before the dot-com crash or the 23% before the Great Financial Crisis. If these mega-cap stocks stumble, they could take the broader market down with them.
Much of this concentration stems from sky-high valuations. The table below highlights why the “Magnificent 7” stocks may be at risk:
Data as of March 11, 2025
Peter Lynch famously wrote, “The P/E ratio of any company that’s fairly priced will equal its growth rate.” That means a P/E-to-growth (PEG) ratio of 1. High-quality growth companies can still justify ratios up to 1.5, but some of these numbers look stretched — especially if earnings growth slows in a recession. If the economy slumps due to a trade war, the Magnificent 7 could fall more than 20%.
Historical Awareness: This Is What the Market Does
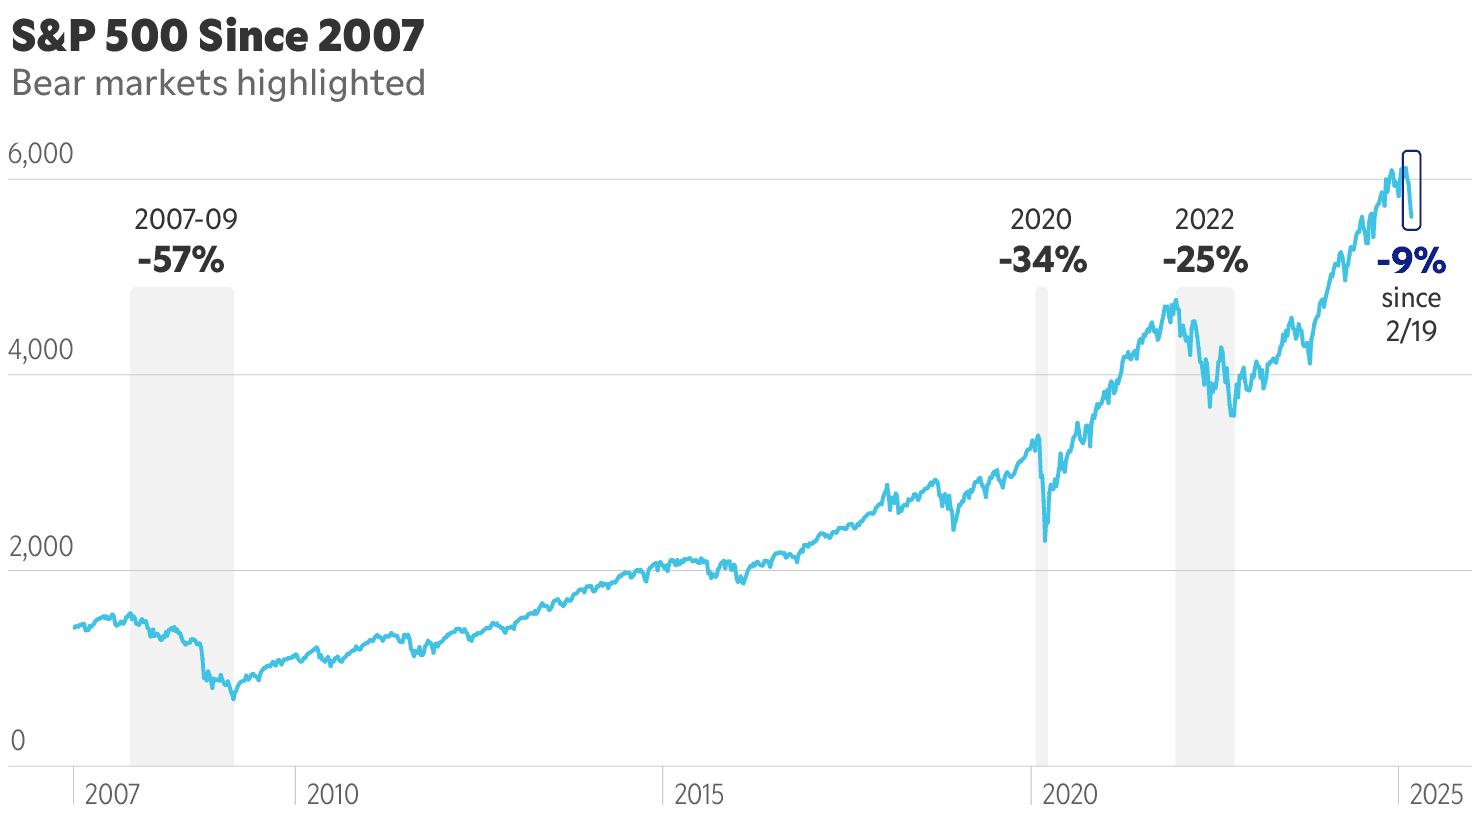
Navigating volatility is never easy for any investor. But it’s important to remember that over the last 75 years, the S&P 500 has fallen roughly 10% from highs every year or so. Yet, each time, it has recovered to go onto higher highs. Every. Single. Time.
It often takes a few months, maybe a couple of years. But a diversified basket of U.S. stocks has shown remarkable resiliency since the end of World War II.
And that has created exceptional wealth for investors willing to sit through and invest in down markets. As Morgan Housel has written: “Most of the money you make in a bull market actually comes from what you did in the bear market.”
There’s a big caveat though: The stock market resiliency pertains to a nicely diversified basket of stocks like the S&P 500 or the TSX Composite. The same is not true for any one stock.
Studies show that around 40% of all companies over the last 45 years have fallen more than 70% from their all-time highs and never came back.
Those of us who invested during the COVID-19 boom have likely felt this pain. Stocks ballooned post-pandemic but then deflated during the 2022 interest rate and banking bear market. Many high-flying stocks from four years ago have lagged from their previous highs, while the market as a whole, like historical clockwork, rallied back to all-time highs through last month.
We Live in Interesting Times
While no one can control or predict the broader market, investors can control how they respond and prepare. Understanding the risks, adjusting expectations, and staying focused on long-term fundamentals will be critical in navigating what comes next.
Over three decades at The Motley Fool, we’ve honed core principles that are our North Star toward long-term investing success. There are no guarantees in investing, but we recommend these tenets in bull and bear markets alike:
- Invest in the market only capital you don’t need for the next 3 to 5 years.
- Own a diversified basket of 25 or more Fool recommendations.
- Hold stocks on average for at least 5 years (be an owner not a trader).
- Invest regularly through all market conditions.
- Hold through market volatility.
- Know that your stocks will routinely rise or fall 20% to 50% or more.
- Expect 80% of your gains to come from 20% of your stocks.
- Let your portfolio’s winners continue winning.
- Target long-term returns.
- Use cash positions for ballast and opportunities.
What The Motley Fool Is Doing
With history notes in hand and leading principles in mind, here are some actions our analysts are taking.
Stay Invested and Continue Investing
We are not all-in or all-out. We want to keep investing and stay the course in good and bad times. The Fool’s analysts are still making buy recommendations!
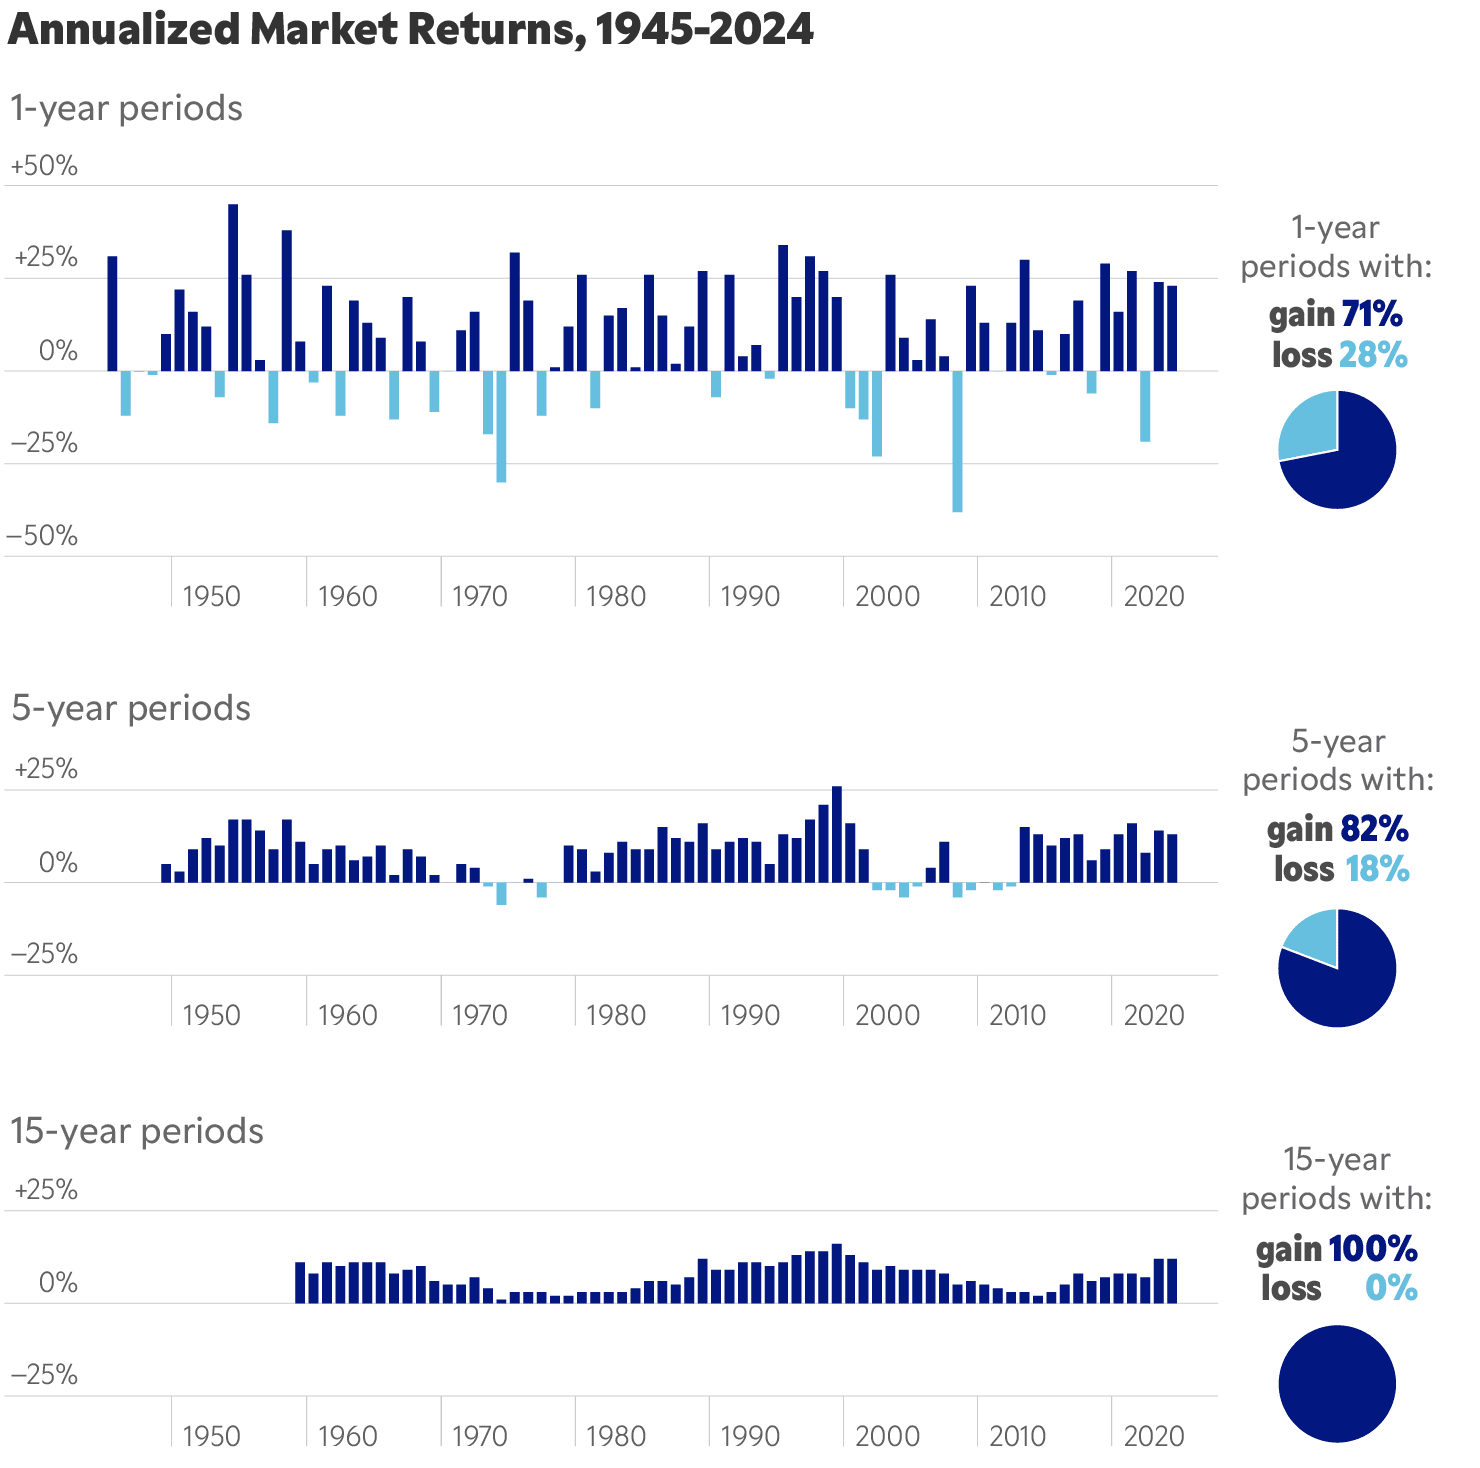
We’re keeping our money in the market — because time in the market is our greatest asset, and no one can time the market. While short-term volatility is painful, there’s no way to know when the market will rebound. If you fight the temptation to sell, you can see how staying invested smooths out year-to-year volatility into long-term positive returns:
Add Diversification
We recommend diversifying portfolios that lean heavily on volatile growth companies with stable, financially robust, lower-volatility companies and stocks.
Watch Large Positions
We’re mindful of very large positions. If a stock, even of a great company, has grown to be more than 15% of a portfolio, we’ll want to make sure we’re very comfortable with the long-term prospects. Run a thought exercise: How would you feel if that stock fell 25% from today?
Consider Cash
We recommend setting aside some cash give your portfolio more optionality during volatile times. You can start with a baseline of 5% to 10% of your investable assets and adjust based on risk appetite and portfolio holdings.
The more high-growth and volatile a portfolio is, the more cash you’ll want to have handy.
Conclusion
Drawdowns. Corrections. Bear markets. Black Mondays. We can’t avoid them. In fact, they’re a natural part of the capitalist system.
But we can learn how to manage through them — and even use them to our advantage.